I've been blogging at http://lowlywonk.blogspot.com for most of my time in grad school, and now it's time for a change. I'm still interested in public policy, but my so much of work is computational now. It just makes more sense to have "computational" in the name of the blog.
So please point your blog readers to http://compSocSci.blogspot.com so the adventure can continue.
(The contents of this blog will remain online, searchable, etc. for the forseeable future.)
Monday, October 24, 2011
Wednesday, September 7, 2011
Latex: tikz
In the runup to APSA, I discovered the absolutely fantastic tikz package for diagrams in LaTex.
See the gallery of example here.
Here are some links that were helpful for preparing my presentation:
See the gallery of example here.
Here are some links that were helpful for preparing my presentation:
- http://www.jmilne.org/not/CDGuide.html
- http://heather.cs.ucdavis.edu/~matloff/beamer.html
- http://www.latex-community.org/forum/viewtopic.php?f=5&t=1152
- http://www.texample.net/tikz/examples/
- http://www.uncg.edu/cmp/reu/presentations/Charles%20Batts%20-%20Beamer%20Tutorial.pdf
- http://faq.ktug.or.kr/wiki/uploads/beamer_guide.pdf
Tuesday, September 6, 2011
Topics that came up at ASPA, part 1.
I'm looking over my notes from APSA, highlighting papers, ideas, etc. that looked worth passing along. As usual, some of these were new to me, and others are just worth knowing about.
From a section on game theory and experimentation:
From a section on game theory and experimentation:
- Quantal response equilibrium
- Experience-weighted attraction
- Beauty contests and level-k reasoning
- "Strategic Information Transmission," Crawford and Sobel
- z-tree software for economic experiments
- Maskin and Tirole on pandering in democracy
- A Behavioral Theory of Elections, by Bendor, Diermeier, and Siegel
- A Handbook of Experimental Economics, Roth
- Groves-Ledyard mechanism
- Cyert-March rule
- Predictably Irrational, Ariely
- Global Games
- Ecological rationality
Monday, September 5, 2011
Slides from APSA: Why do people blog about politics
Back from APSA!
Here is the final version of my presentation slides. I'm not going to post the paper because it's in the process of splitting into three, but I'm happy to share by email if you're interested.
On with the job search!
Here is the final version of my presentation slides. I'm not going to post the paper because it's in the process of splitting into three, but I'm happy to share by email if you're interested.
On with the job search!
Tuesday, August 30, 2011
Hard-learned lessons on data merging
For my APSA paper this year, I had to merge two survey data sets, and do a bunch of work with imputation and instrumental variables. To complicate things, I was working with a student on the merge.
Here are some lessons learned:
1. Agree on an outline before doing the data work.
Know the main steps going in, and write them as comments in the code. This will make the logic of the data work more clear, which is helpful for debugging. For long merges, it can be motivating to see your progress as you go along. Also, if the steps need to change, it's good to realize why the original plan didn't work.
2. Stick to an intuitive naming convention for variables, data sets, etc.
Yes, you'll have to type out longer variable names, but you'll save a ton of time in debugging. For instance, "october_cleaned_dataset" instead of "d2.10c".
3. Store files as .csv, not .dat.
R's "save" command isn't fully compatible across versions and operating systems. Instead, save small-to-moderate datasets as .csv files. That way, compatibility won't be an issue. (Plus you can open the same files in other programs, like STATA or excel.)
4. Use names, not numbers.
Don't use commands based on row or column numbers: data_set[,c(1:4,7,8,23)]. They're hard to read, and they're brittle: if a new column gets inserted in data_set, that code isn't going to work anymore. Instead, use variable names: data_set[,c("time1","time2","time3","time4","age","gender","year")]. Regular expressions can be very helpful here: data_set[,append(grep("time.", names(data_set)), c("age","gender","year"))]. Yes, it takes longer to write, but you'll save a huge amount of time debugging.
Monday, August 8, 2011
The world's fastest demo for RStudio in EC2
Last week I posted instructions to get started with RStudio on Amazon's Elastic Compute Cloud. Here are new and improved* instructions (docx, pdf). These steps should be enough to get you into the cloud in 15 minutes or less, for free.
Please let me know in the comments if you have any trouble or questions with this demo. I'm trying to lower the startup costs for people to do computational social science, so I'm happy to be a resource for others working their way down the cloud computing path.
Cheers!
PS - The instance comes with several fun R libraries pre-installed: tm, igraph, and twitteR.
*I've 1) dropped several steps that aren't necessary for running RStudio, 2) added a few screenshots, and 3) clarified a steps that were giving people trouble. Thanks again to Kevin J. for putting together the original slides.
Monday, August 1, 2011
Mining and visualizing twitter from RStudio in EC2
Here's code I'm going to use for my ICPSR class today. This is set up to run immediately from an EC2 instance of my AMI agongRStudio2 (ID:ami-1bb47272). It's the simplest introduction to text mining I've been able to pull together so far.
Step-by-step instructions for getting started in EC2 are here (pdf and docx). These are intended to get you started in command-line R. For this exercise, we want to use the RStudio GUI instead, so there are a few changes.
1. On step 6, use this Community AMI: agongRStudio2 / ami-1bb47272
2. On step 8, you don't need to download the keypair. "Proceed without a keypair" instead.
2. On step 9, you also need to enable port 8787, the port the RStudio server uses.
3. On step 11 stop following the tutorial. Instead, open up your EC2 URL in your browser, with port 8787. It will look something like this:
4. I'll give out the username and password in class. If you're not in the class, email me and I can clue you in.
5. Here's a first script to run
PS - Don't forget to terminate your EC2 instance when you're done, or you will use up your free hours, then run up a smallish (~50 cents/day) Amazon bill until you remember
Step-by-step instructions for getting started in EC2 are here (pdf and docx). These are intended to get you started in command-line R. For this exercise, we want to use the RStudio GUI instead, so there are a few changes.
1. On step 6, use this Community AMI: agongRStudio2 / ami-1bb47272
2. On step 8, you don't need to download the keypair. "Proceed without a keypair" instead.
2. On step 9, you also need to enable port 8787, the port the RStudio server uses.
3. On step 11 stop following the tutorial. Instead, open up your EC2 URL in your browser, with port 8787. It will look something like this:
http://ec2-123-45-67-890.compute-1.amazonaws.com:8787/
4. I'll give out the username and password in class. If you're not in the class, email me and I can clue you in.
5. Here's a first script to run
library(twitteR)We're going to be trying this in class. I have 20 minutes budgeted, so hopefully it's really this easy.
library(tm)
library(wordcloud)
#Grab the 200 most recent tweets about #bachmann
#http://www.slideshare.net/jeffreybreen/r-by-example-mining-twitter-for
k = 200
my_tweets <- searchTwitter("#bachmann", n=k)
#Convert tweet status objects to text
#http://www.r-bloggers.com/word-cloud-in-r/
my_text <- data.frame( text=unlist( lapply( c(1:k), function(x){my_tweets[[x]]$text} ) ) )
#Convert text to a tm corpus object
my_corpus <- Corpus( DataframeSource( my_text ) )
my_corpus <- tm_map(my_corpus, removePunctuation)
my_corpus <- tm_map(my_corpus, tolower)
my_corpus <- tm_map(my_corpus, function(x) removeWords(x, stopwords("english")))
#Convert corpus to matrix
tdm <- TermDocumentMatrix(my_corpus)#, control = list(weighting = weightTfIdf))
m <- as.matrix(tdm)
#Get features and frequencies
v <- sort(rowSums(m),decreasing=TRUE)
d <- data.frame(word = names(v),freq=v)
#Display as a word cloud
wordcloud(d$word,d$freq,min.freq=5,use.r.layout=T,vfont=c("sans serif","plain"))
#Basic bluster analysis of words
#From: http://www.statmethods.net/advstats/cluster.html
m2 <- m[colSums(m)>15,]
dist_matrix <- dist(m2, method = "euclidean") # distance matrix
fit <- hclust(dist_matrix, method="ward")
plot(fit) # display dendogram
PS - Don't forget to terminate your EC2 instance when you're done, or you will use up your free hours, then run up a smallish (~50 cents/day) Amazon bill until you remember
Monday, July 25, 2011
Brand sentiment showdown...
From FlowingData. I may use this in my ICPSR class on computational social science next week. What do you think?
Brand sentiment showdown: "


 "
"
Brand sentiment showdown: "

There are many brands on Twitter that exist to uphold an image of the company they represent. As consumers, we can communicate with these accounts, voicing praise or displeasure (usually the latter). Using a simple sentiment classifier1, I scored feelings towards major brands from 0 (horrible) to 100 (excellent) once a day for five days.
The above for example, shows scores for Netflix, Hulu, and Redbox. Netflix had the lowest scores, whereas Redbox had the highest. I suspect Netflix started low with people still upset over the price hike, but it got better the next couple of days. Then on Saturday, there was a score drop, which I'm guessing was from their downtime for most of Saturday. Hulu and Redbox, on the other hand, held more steady scores.
As for auto brands, Toyota clearly had the lowest scores. However, Lexus, which is actually a luxury vehicle division of Toyota had the highest scores in the high 90s to 100.

How about the major mobile phone companies, AT&T, Verizon, and Sprint? Verizon scored better initially, but had lower scores during the weekend. Not sure what was going on with Sprint.

Between Twitter and Facebook, there was obviously some bias, but Twitter faired slightly better. Twitter scored lower than I expected, but it probably has to do with bug reports directed towards @twitter.

Is Domino's Pizza good now? Papa John's stayed fairly steady while Pizza Hut scores were sub-par.

Finally, as a sanity check, I compared airlines like Breen did in his tutorial. Results were similar with JetBlue and Southwest clearly in the positive and the others picking up the rear.

Any of these scores seem surprising to you?
- Jeffrey Breen provides an easy-to-follow tutorial on Twitter sentiment in R. The scoring system is pretty basic. All you do is load tweets with a given search phrase, and then find all the 'good' words and 'bad' words. Good words give +1, and bad words give -1. Then a tweet is classified good or bad based on the total. Then to get a final score, only tweets with total of +2 or more or -2 or less are counted. The final score is computed by dividing number of negative tweets divided by total number of 'extreme' tweets. Obviously this won't pick up on sarcasm, but the scoring seems to still do a decent job. I wouldn't make any important business decisions based on these results though.
The new FlowingData book is available now.
Friday, July 15, 2011
Automated snowball census
After a lot of work, I pushed the new version of the paper to SSRN today. Getting ready to pack it up, send it off for review, and move on to the next thing.
Tuesday, July 12, 2011
How are new media reshaping politics? Take 2
Yesterday I posted on Hidman's "missing middle" hypothesis. Kudos to my good friend Ben Peters for some great, thought-provoking responses. Today, I'm going to push forward and respond to another great thinker in this area: Benkler's theory of the "networked public sphere."
Benkler and the Networked Public Sphere
On the other side of the debate, Yochai Benkler is an Internet optimist. He argues that many-to-many communication will invigorate the public sphere, leading to broader intake of ideas, better discussion, and ultimately better governance. Benkler is very critical of the media oligopoly of the mid-20th century, which he says was heavily influenced by money and ideology, and excersized outsized control on public access to information. According to his account, the current proliferation of online information sources is certainly better than being dependent on a handful of corporate broadcasters, even if it still falls short of utopia.
This picture of the public sphere is appealing and not entirely untrue. I want to believe it. However, Benkler fails to take into important and well-established facts about American political system.
First, most citizens in the U.S. are poorly equipped to deal with political information. Converse's half-century-old finding that as many as 90 percent of Americans are "innocent of ideology" (i.e. they have no idea what "liberal" and "conservative" mean) has been replicated and extended many times. Most voters don't know how government works, they don't know how it's supposed to work, and they don't care to find out. True, partisan cues, endorsements, and heuristics can sometimes bring voters up to speed enough to fill out a ballot, but these heuristic strategies cannot inform most citizens for participation in the public sphere the way Benkler imagines. We must distinguish between the handful of citizens who are motivated and equipped to reason about politics, and the majority who are not so prepared or inclined. Benkler's optimism really only extends as far as the electorate is capable of reasoning about democracy.
Second, Benkler ignores the structure of government and policymaking. He treats "government" as a unitary actor, and makes only passing reference to elections and political parties. Benkler is painting with a broad brush, so perhaps he can be forgiven for ignoring the institutional details of representation and government in American politics. However, those details are likely to matter, deeply.
Consider: primary responsibility for lawmaking in the U.S. falls to elected legislators. These legislators are influenced not only by the ebb and flow of ideas in public debate, but by their ability win in zero-sum, partisan elections. Proliferation of information sources may affects public debate for the better, but it also affects the electoral pressures faced by public officials. We have strong reason to believe that access to additional channels, selective exposure, and ideological pandering are leading to increased polarization in the electorate. What if this polarizing electoral effect dominates the enriching discursive effect that Benkler outlines?
I'm sympathetic to the the idea of a networked public sphere. As I said earlier, I really want it to be true. But Benkler's picture ignores key institutions in American politics, like elections and parties, so I have a hard time placing much faith in his predictions. We need to think carefully about the interplay of partisanship, ignorance, and representative government with technologies that allow cheap, many-to-many communication.
How are new media reshaping politics? Take 1
I've been studying political blogging for a couple years now, and I'm getting ready to bring it all together into a dissertation. That means it's time to move past statistics and data, and start thinking in terms of Big Ideas.
As I see it, the pressing question is "How are new media (including blogs) reshaping American politics?" This is a big question -- one that certainly matters outside of academia. But that won't stop me from writing about it in a dry, academic way. :) To my mind, Matthew Hindman, Yochai Benkler, and Cass Sunstein have put forward the three leading, competing theories for answering this question. This week, I'm going to make a first attempt at responding to and synthesizing their ideas.
Feedback and constructive criticism are very welcome.
Hindman and the Missing Middle
Matthew Hindman is an Internet pessimist. In his book, The Myth of Digital Democracy, he argues that the web has exacerbated the "rich get richer" tendencies of media markets, leading to greater inequality. To back up his assertion, he shows that links and traffic to web pages follows a power law distribution. He also interviews top 40 bloggers and claims that they are overwhelmingly white, male, high-income, and educated. His analysis suggests that the people with big audiences online are no different from those offline. Hindman labels this dramatic inequality between popular and unpopular sites "the missing middle."
However, Hindman's line of attack has two important weaknesses. First, he has no counterfactual. The distribution of online audiences is dramatically unequal, but the same is (and was) probably true offline as well. Certainly, Barack Obama, Michelle Bachman, and Thomas Friedman have daily audiences that are orders of magnitude larger than mine or yours. The same was true of their counterparts before the Internet. Audiences online are distributed unequally, but are they more unequal than those that existed offline, before the Internet? Hindman does not answer this question, and I suspect the answer is no.
Second, Hindman ignores the potential for indirect influence. The Drudge Report is one of the most heavily trafficked blogs* on the Web, but Drudge himself writes almost no content. Instead, the site features links to stories elsewhere on the Internet. How then do we think about Drudge's influence? He inserts no new ideas into public debate, but exercises some ability to influence which ideas get attention. By linking to other authors' stories, Drudge allows those authors to exercise indirect influence on his readers.
Drudge is an extreme case of the common online practice of linking. Linked content intrinsically gives others indirect influence. It is not unique to the online world (think of citations, endorsements, recommendations), but it is probably more common there. Network theory shows us that all else equal, more re-linking leads to more egalitarian distribution of indirect influence. By focusing only on direct readership, Hindman misses this possibility.
The bottom line: Hindman is the skeptic in this debate, arguing that the Internet means business as usual for participation, voice, and influence. He's only right as long as we assume that 1) offline participation is not also unequal, and 2) only direct influence (i.e. readership and web traffic) matters.
Monday, July 11, 2011
+Computation: Got an AWS in Education grant!
I just received a generous grant for usage on Amazon's Web Services -- cloud computing, storage space, and bandwidth. This is just in time for a bunch of heavy-duty text crunching I've been planning to do. Thank you, Amazon!
Wednesday, June 22, 2011
Political science and big data resources from JITP
I'm cleaning out papers from my files, tired of carrying around all these dead trees. Here are notes on nifty resources mentioned at the JITP conference a few weeks ago.
TDT: topic detection and tracking (http://projects.ldc.upenn.edu/TDT/)
Socrata, the Open data company (http://www.socrata.com/)
Google's Data Liberation Front (http://www.dataliberation.org/)
TESS: Time sharing experiments in the social sciences (http://www.tessexperiments.org/)
TREC (Text retrieval conference) benchmark data sets (http://trec.nist.gov/data.html)
And the good old American National Election Study (ANES) (http://www.electionstudies.org/)
Monday, June 20, 2011
Laptop vs Clipboard
Things that could destroy my:
PS: This list was created as my flight into Detroit was descending, and "all personal electronic items" had to be switched off.
| Laptop | Both | Clipboard |
| Coffee Falling Power surges Worms and viruses Rain Babies EMPs Losing the power cable Tripping on the power cable Planned obsolescence Stomping Yogurt Crumbs The AllSpark Big magnets | Fire Karate experts Garbage compactors Lightsabers | Termites Beavers Very strong wind |
PS: This list was created as my flight into Detroit was descending, and "all personal electronic items" had to be switched off.
Saturday, June 18, 2011
Resources from PolNets
Note from Saturday, at the Political Networks conference. The presentation went swimmingly. I think there are more sociologists than political scientists here today.
Here are links to nifty resources referenced in talks:
Affective Norms for English Words (ANEW): http://csea.phhp.ufl.edu/Media.html#bottommedia
Networks, Computation, and Social Dynamics Lab at UC Irvine: http://www.ncasd.org/public_html/
OpenCongress RSS feeds: http://www.opencongress.org/about/rss
Public.Resource.Org: https://public.resource.org/
Thursday, June 16, 2011
Netroots Nation
I'm at the Netroots Nation conference in Minneapolis, really enjoying it. Some reactions from day one:
* Lots of discussion of messaging and issue ownership. This is an area that academic researchers haven't really embraced, especially us quants. We should.
* The community is really open and egalitarian. I sat in the same panel with Markos Moulitsas for half an hour without realizing it.
* I've been impressed by the sophistication of research design in analytics and message experiments. It's got me thinking about what's the next step after AB testing... There's room for innovation here.
* The left-meets-right happy hour was kind of a flop. Where were all the Republicans?
Tuesday, May 17, 2011
Slides from JITP: The Future of Computational Social Science
I'm at JITP's conference on the future of computational social science this week. Really interesting gathering of social scientists (and a smattering of CS people) interested in computational social science. I'll blog more thoughts on the conference once it's over (tonight).
For now, I'll post the resource I already have put together: my conference slides.
For now, I'll post the resource I already have put together: my conference slides.
Thursday, May 12, 2011
Computational social scientists: a draft directory and basic survey results
Last week, some of us* at Michigan's Center for Complex Systems circulated a survey of computational social scientists -- trying to find out who self-identifies as a compSocSci person and what they study, so that they can be in touch with each other.
We had just under 100 responses, from people at many different institutions, working in a wide variety of areas. Here are some early results.
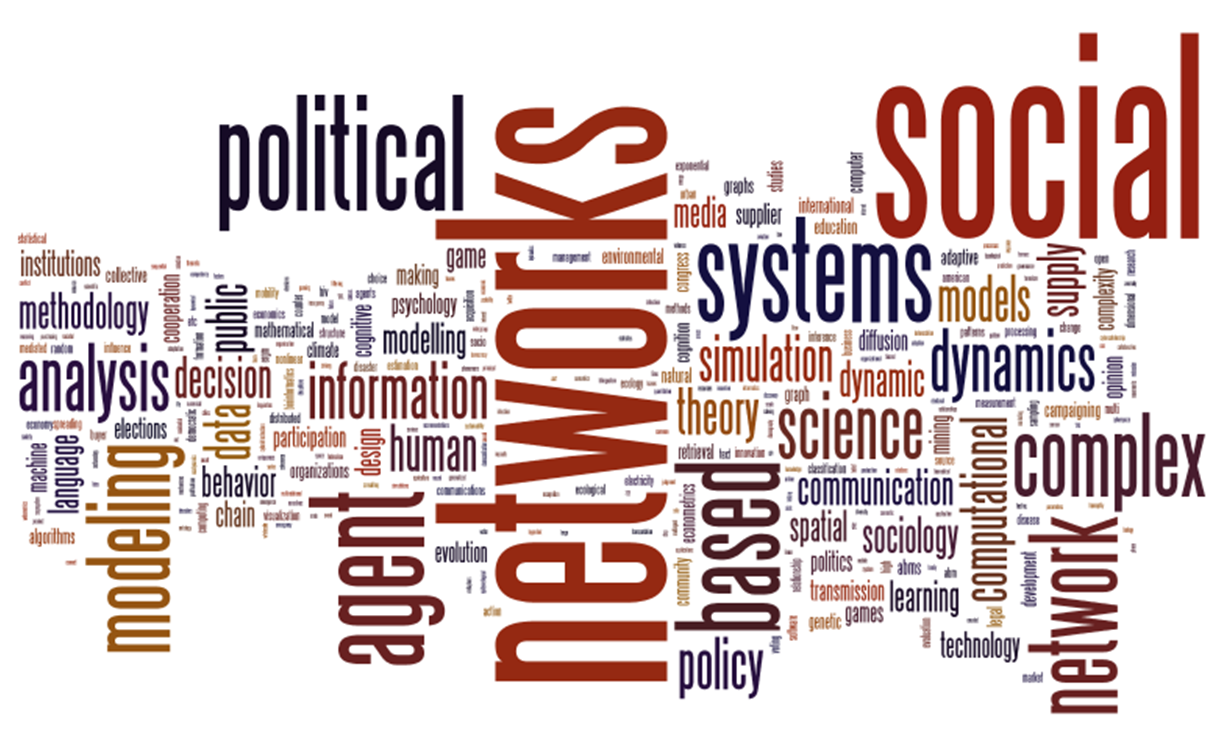
First, the obligatory word cloud. This isn't particularly scientific, but it illustrates the concepts that people find important in this space. Not surprisingly, we had a strong showing from network people and agent-based modelers.

We also asked about broad areas where people had formal training and were currently working. The two are pretty similar, so I'll just show the graph on training.

More results, and a revised version of the directory will be forthcoming in a couple weeks. Please let us know if you have any questions. We hope these will be useful resources for the community.
Click here to take the survey. We'll keep it open for another couple weeks, so that responses can continue to trickle in.
Click here for the directory in pdf format. (To avoid spam, this doesn't include email addresses. Email me if you want a copy that includes emails.)
* Scott Page, Dan Katz, and I
We had just under 100 responses, from people at many different institutions, working in a wide variety of areas. Here are some early results.
First, the obligatory word cloud. This isn't particularly scientific, but it illustrates the concepts that people find important in this space. Not surprisingly, we had a strong showing from network people and agent-based modelers.
We also asked about broad areas where people had formal training and were currently working. The two are pretty similar, so I'll just show the graph on training.

More results, and a revised version of the directory will be forthcoming in a couple weeks. Please let us know if you have any questions. We hope these will be useful resources for the community.
Click here to take the survey. We'll keep it open for another couple weeks, so that responses can continue to trickle in.
Click here for the directory in pdf format. (To avoid spam, this doesn't include email addresses. Email me if you want a copy that includes emails.)
* Scott Page, Dan Katz, and I
Wednesday, May 11, 2011
R code to remove the second line of a Qualtrics .csv
I love Qualtrics, but its data export does this obnoxious thing. Instead of exporting a regular .csv file, it exports a csv with two header rows. The first one contains short variable names (e.g. Q1, Q2.2, Q3_TEXT) and the second one contains labels ("How old are you?", "What is your email address?")
I keep having to figure out how to tell R how to deal with this messiness. It's not complicated, but I have to look up the read.csv documentation every time.
No more. Here's my code:
DF <- read.csv("my_file.csv", skip=2, header=F)
DF2 <- read.csv( "my_file.csv" )
names(DF) <- names(DF2)
I keep having to figure out how to tell R how to deal with this messiness. It's not complicated, but I have to look up the read.csv documentation every time.
No more. Here's my code:
DF <- read.csv("my_file.csv", skip=2, header=F)
DF2 <- read.csv( "my_file.csv" )
names(DF) <- names(DF2)
Tuesday, May 10, 2011
I'm number one on Amazon turk!
I just maxed out my credit card to get a whole bunch of work done on mTurk. For the moment, I'm the number one requester on the site!
Screen shot:

Early results look pretty good. A few turkers cheat, but I've been pleased with the good-faith effort most people seem to put into their work.
PS - I'm curious about what Randolph Stevenson (in the number 3 slot) is doing...
Screen shot:

Early results look pretty good. A few turkers cheat, but I've been pleased with the good-faith effort most people seem to put into their work.
PS - I'm curious about what Randolph Stevenson (in the number 3 slot) is doing...
Thursday, May 5, 2011
Working paper: An automated snowball census of the political web
Here's my paper for the JITP Future of Computational Social Science conference in a couple weeks. This paper describes my process for using SnowCrawl and a highly trained text classifier to search out political web sites -- pretty much all of them -- on the web.
Final census results are available here. I'm planning to run another iteration of this census before too long. I welcome comments and suggestions.
Final census results are available here. I'm planning to run another iteration of this census before too long. I welcome comments and suggestions.
Sunday, May 1, 2011
Friday, April 29, 2011
Computational politics: U.S. House legislation may move to XML?
http://thehill.com/blogs/hillicon-valley/technology/158339-boehner-cantor-want-house-to-use-open-data-formats
This would be a huge boon to computational social scientists and groups like the Sunlight Project
This would be a huge boon to computational social scientists and groups like the Sunlight Project
The economics and politics of the Death Star
The economics and politics of the Death Star
"What’s the economic calculus behind the Empire’s tactic of A) building a Death Star, B) intimidating planets into submission with the threat of destruction, and C) actually carrying through with said destruction if the planet doesn’t comply?"
Fun discussion with lots of analogies to history and current politics
Tuesday, April 26, 2011
Is bitcoin a decentralizing, democratizing agent?
A response to Duane on the importance of bitcoin as a new, decentralized currency. (This has been a fun running debate among friends over the last couple weeks.)
I read his recent post as claiming "decentralized is better." My response: "sometimes, but not always." Here's my reasoning.
Point 1: Money is a figment of our shared imagination. It has value because we all collectively accept that it has value. There's nothing particularly special about green paper, or gold rocks, or any given set of bits, except for the common knowledge that other people will also accept those currencies in exchange for goods and services. In that sense, the valuation of any currency is already "democratic" -- its real value exists in the minds of a distributed network of people. People were using rare stones as currency long before governments got involved.
Point 2: Enlightened self-interest leads us to centralize some of the responsiblity for maintaining currencies. One of the main threats to any currency is counterfeiting, so it makes sense to centralize responsibility for preventing counterfeiting to mints and enforcement agencies like the secret service. Another threat is inflation (or deflation), which is why every modern state with a large economy uses a central bank to manage inflation via the money supply. A third "threat" is transaction costs, which is why we use credit cards for so many things -- the artificial "currencies" maintained by these corporations are so convenient that they have displaced state-authorized currency in many transactions*.
Point 3: As a side-effect of centralization, governments gain some power to regulate other uses of money. (Note that governments, like currencies, are also a figment of collective imagination. The Constitution is law because we all agree that it's the law.) Thus, the imposition of taxes, tariffs, and embargoes; and continuing efforts by organized criminals to circumvent the system by laundering money. These things are not necessarily good or bad. They depend on whether we approve of the use of government power in those areas. By and large, I imagine most people approve of governments shutting down mobsters and sex trafficking rings. Using the same suite of tools for defense spending, planned parenthood, agricultural subsidies, "bailouts," etc. is more controversial.
On the whole, I'd argue that people are better off because governments have these capabilities at their disposal -- especially people living in places where government is reasonably transparent and accountable to its citizens. We're better off because we've decided to pay taxes for roadways, police stations, and schools. We're better off because the value of a dollar is reasonably stable. We're better off because corporations (especially publically traded firms) are forced to keep a strict accounting of their transactions. We're better off because the FBI and CIA can use financial information to crack down on terrorists and organized criminals.
Putting that all together, I see bitcoin as an attempt to float an unregulateable currency using P2P technology and cryptography. By construction, such a currency would make it very difficult for government to intervene in the ways discussed in points two and three. Although I don't agree with everything our government does**, I don't see compelling reasons to deny ourselves the ability to use those tools as a society. Together, we're made better off by careful use of centralized financial regulation and lawmaking. That being the case, bitcoin seems partly radical, partly old hat, and partly a step backwards.
*Semantic question: are credit cards a centralized or decentralized currency? What about frequent flyer miles? What about Subway sandwich discount punch cards? At some level, the labels "centralized" and "decentralized" are too blunt to be really useful. This seems related to Duane's comments about needing both more and less regulation.
**Nobody does. That's the nature of compromise.
Monday, April 25, 2011
The best $5 I've spent all year
I finally started using Amazon's EC2 yesterday. I've been meaning to learn it forever, but assumed it would be time-consuming to get registered, set up an instance, and so on.
Not true. Thursday morning at 10am, I registered for EC2. By 10:30 I had an instance of Drew Conway's Py/R AMI up and running, with several additional libraries installed, and a few GB of data I wanted to crunch uploaded to the server. Very fast turnaround.
Eight hours and $4.77 later, I'd crunched a lot of numbers -- by far my most productive workflow all week. Highly recommend it.
Friday, April 22, 2011
Scalable education
I got a lot of great responses on my previous post about scalable education, and wanted to share them back out here. I also got a lot of questions on what I meant by "scalable" education. Let me speak to that first.
Thesis: the number of students getting a good education today is about 20 times the number of good teachers. Under our current classroom model, "number of high-quality teachers" is the limiting variable. By scalable education, I mean models of teaching that could feasibly grow to orders of magnitude greater than 20 -- systems that would allow one good teacher (plus the right support system) to teach 2,000 or 2,000,000 kids.
Here's a loosely annotated list of links to proposed models of "scalable education," sorted from least to most:
Jump - New curriculum deployment. Not bad, but not revolutionary.
PBS documentary on "digital learning" - This is a mixed bag. Some models (e.g. the Smithsonian scavenger hunt) are neat, engaging students in new ways. I was less impressed with several segments that are just trading classrooms for classrooms plus computers.
Teach for America - TFA's teachers do a lot of good, but they also tend move on quickly. (This may be changing.) On the other hand, TFA is very proactive about maintaining their alumni network. If this is going the be revolutionary, it will be as a policymaking network, more than a teaching force.
itunes-U - Possibly revolutionary. But content delivery < education.
TED - "The first major educational brand to emerge in a century." Very cool topics, but see previous.
Harvard's Distance Education - Lectures are free; course credit with the Harvard brand cost $. Many universities are doing this; Harvard is probably the best known. This is changing things, but I'm not sure how competition is going to play out in this space.
The Khan Academy - My number one vote for a potentially disruptive model of education.
Thursday, April 21, 2011
Angry birds and agent-based modeling
"How +1 modeling can strengthen the logic of simulation and keep your pigs intact."
Wednesday, April 20, 2011
What I've been watching lately
Ralph Lagner's fascinating TED talk on reverse-engineering the Stuxnet worm. This is the best presentation on cyber-terrorism/security I've seen so far.
The bubble sort algorithm, illustrated as a Hungarian line dance. (via flowingdata) Fun, but a little long. What sort of dance could illustrate a heap sort?
A quick (4min) TED talk on Google's driverless cars. Nifty.
The bubble sort algorithm, illustrated as a Hungarian line dance. (via flowingdata) Fun, but a little long. What sort of dance could illustrate a heap sort?
A quick (4min) TED talk on Google's driverless cars. Nifty.
Tuesday, April 19, 2011
Code: a random web crawler
This code crawls the web to generate a pseudo-random sample of web sites. Not my prettiest code, but it works and may save somebody an afternoon of coding.
random_crawler.tar.gz (14MB, zipped)
random_crawler.tar.gz (14MB, zipped)
This script explores the web for a pseudo-random sample of sites. The crawl proceeds in a series of 100 (by default) waves. In each wave, 2,000 (by default) crawlers attempt to download pages. When page downloads are successful, all the unique outbound hyperlinks are stored to a master list. Then sites for the next round are sampled.
Sites from common domain names are undersampled, to avoid getting stuck (e.g. within specific social networking sites). When sites are selected for the next round, weights are equal x^(3/4), where x is the number of sites in the same domain.
After several waves, the sample should be well-mixed -- a pseudo-random sample of the web.
Note: This code is kind of sloppy, does not scale well, and is poorly commented. Bad code! Bad!
Monday, April 18, 2011
Another data resource
I'm on a real data kick this week. Here's another one that should be useful for people training language classifiers.
lang_samples.tar.gz (1.5G gzipped)
lang_samples.tar.gz (1.5G gzipped)
This archive contains language samples from the 2008 static wikipedia dumps available at http://static.wikipedia.org/downloads/2008-06/. I downloaded all 261 archives, and extracted samples of text from each.
Saturday, April 16, 2011
What does it take to be a data scientist?

The full article is here. It's short and sweet, and offers a nice counterpoint to some of the claims made by people with a more computer-science-centric view of the world. Turns out that modeling assumptions (i.e. math and statistics) and theory (i.e. substantive expertise) matter. You ignore them at your own risk.
PS: The title makes it sound like this is about U.S. intelligence, but almost all the points in the article apply to business and academia as well.
Friday, April 15, 2011
More text archives
Three more data sets (108MB, gzipped) for training classifiers. All these files are text-only, crawled in the week of 12/17/2010. It just took me a while to get around to releasing them.
political (115M):
Front pages from ~2,500 political sites. These sites were rated extremely likely to be political (p>.99) in an early version of my census of the political web. I revisited the same sites several months later and downloaded the new front pages to create this dataset. They should be appropriate for case-control training of a political classifier.
random (471M):
Front pages from ~8,000 "random" sites. These are a pseudo-representative sample of the web. I ran several web spiders in parallel, recording all outbound links from visited sites. I deliberately undersampled common namespaces, in order to avoid getting trapped in densely-linked social networking sites. The 8,000 sites are a random sample from a list of ~2 million sites generated in a crawl of this type.
porn (43M):
Front pages from ~1,200 pornography sites. I never thought I'd be curating pornography as part of my dissertation, but so much of the web is porn that I've had to build special classifiers to screen it out before sending to my undergrad research team for coding. These 1,200 sites were all linked from http://research.vision-options.com/research.php.
Thursday, April 14, 2011
It's data dump week!
In case this wasn't clear already, it's data dump week. I'm gearing up for another crawl of the political web, and posting lots of bits of code and data along the way. If nothing else, I'll be able to find them here in the future. If these (or similar) resources are useful to you, please let me know.
Cheers!
Cheers!
Data release: 75K political web sites
Data release:
pol_site_sample.tar.gz (1.2GB, gzipped)
pol_site_sample.tar.gz (1.2GB, gzipped)
This archive contains results from a front-page-only crawl of ~75,000 political web sites on 4/9/2011.I'm going to use this to train content classifiers. Might be useful to others as well.
These sites span a large portion of the political web, but they are not a representative sample. Each was classified as very likely to be political (p > 0.9) in a crawl performed in August 2010. In other words, these are pages from sites that featured political content 8 months ago. Presumably, most -- but certainly not all -- of the sites still feature political content today.
Wednesday, April 13, 2011
Tuesday, April 12, 2011
Lightweight pdf renderers
 I'm finishing up dissertation data collection in the next ~6 weeks, which means I'm going to be spending a lot less time writing code, and a lot more time analyzing data and writing papers. So R and laTex are going to be my new best friends.
Taking a good look at my workflow around these packages, I realized that viewing pdfs was really slowing me down. Every time I generate a graph or paper, I have to open up the pdf version and see what it looks like. Adobe's very bulky software takes several seconds to load -- very frustrating when you're playing with margins or table formating and want to iterate quickly.
So I went out looking for a lightweight pdf viewer. Here's what I found:
http://www.downloadmunkey.net/2008/04/random-monday-foxit-reader-vs-pdf-xchange-viewer-vs-sumatra/
http://portableapps.com/node/17260
http://www.techsupportalert.com/best-free-non-adobe-pdf-reader.htm
Any other advice?
Based on those reviews, I'm going to give PDF-XChange a shot. I'll let you know how it goes.
Monday, April 11, 2011
Redesigned my layout
I've been meaning to do this for a while. tpmotd's nudge finally got me to make the neccesary 15 minutes.
Now all my pictures should actually fit!
Now all my pictures should actually fit!
Saturday, April 9, 2011
Prezi: AI and games
A few months ago I first tried out prezi. Since then, I've seen it trickling into presentations here and there. The novelty is great, and the usability is a little better than last time I played with it. So I went ahead and
These are slides for my (mock) TED talk from the Hill Street TED activity yesterday.
These are slides for my (mock) TED talk from the Hill Street TED activity yesterday.
Thursday, April 7, 2011
Crowdsourcing and buzzword lumping
 In general, I'm a big supporter of crowdsourcing, but I worry about lumping together too many things under one popular buzzword. A few NYTimes articles have spoken to this issue recently (ht Gloria). This one is pretty starry-eyed. This one unpacks things (a little) more.
Let me push on this idea of lumping. Wikipedia defines crowdsourcing as
the act of outsourcing tasks, traditionally performed by an employee or contractor, to an undefined, large group of people or community (a "crowd"), through an open call.As I read that definition, all of these are crowdsourcing:

- Wikipedia
- Ideo's open design lab
- Innocentive's innovation contests
- 99design's graphic design sweatshop
- Elections
- Spam farms
- Penny stock pump-and-dump marketing
- Bounty hunters and privateers
My position: We're at a place where technology is enabling new institutions. It would be backward to ignore that potential. But there are all kinds of issues with corruption, lack of expertise, bias in who participates, etc. that "crowdsourcing" doesn't solve automatically. Just like other institutions, crowdsourced institutions have to be designed carefully to head off those problems. I don't think it's a magic bullet, but I do think it can help.
Tuesday, April 5, 2011
Announcing SnowCrawl!
A nnouncing the beta release of SnowCrawl, a python library for directed webcrawls. Nice features include: saved state for backup, support for threading and client-server architecture, lots of flexibility.
The project is open source, hosted at google code. More details to follow.

The project is open source, hosted at google code. More details to follow.
Monday, March 14, 2011
Wanted: A mystery science theater for stats and programming books.
Wanted: A mystery science theater for stats and programming books.
Looking for good introductory R books for non-programmers, (Know any? Books, I mean, not non-programmers.) I ran across this wonderful review of an apparently ludicrous book.
Wow.

Looking for good introductory R books for non-programmers, (Know any? Books, I mean, not non-programmers.) I ran across this wonderful review of an apparently ludicrous book.
Statistical Analysis with R: Beginner’s Guide by John M. Quick
Summary: If you can get past the strange underlying story, then this gives a good introduction to R to someone with no programming experience.
[...]
[B]efore describing the data analysis section of the book, I should explain the underlying story used throughout the book. The introductory chapter gives a bit of ancient Chinese history, and states that you, the reader, have been chosen to succeed the famous military leader Zhuge Liang and need to learn how to use R to analyse his data and plan the future of the military campaign.
The rest of the book takes on this theme, both in the data analysis (comparing the Shu and Wei armies, and predicting battle outcomes using regression) and the general phrasing (headings like “Have a go hero!” and emphasis that if you fail the Chinese kingdom will collapse).
Wow.
Friday, March 11, 2011
Scalable models for education
via my good friend Steve Stay:
The White House has a new initiative out: Winning the Education Future - The Role of ARPA-ED (16 pages)
The intuition here is really interesting -- building technologies for education that scale. Our ed system is based on a 150-year-old chalk-and-talk delivery system. One teacher, ~20 students, one lecture at a time, interspersed with homework, projects, and some small group discussion. I'm stylizing here, but you know I'm not too far off.
The major bottleneck in this system is effective teachers. Roughly speaking, the number of students getting a good classroom education is equal to the number of good teachers times twenty. Given the tremendous difficulty of recruiting, training, and retaining teachers, this is a serious constraint.
Therefore, I am a huge fan of the idea of deploying better education via scalable technology. But I don't think we've seen this done right yet. Some also-rans:
The White House has a new initiative out: Winning the Education Future - The Role of ARPA-ED (16 pages)
To address the under-investment in learning technology R and D, the President’s FY2012 budget proposes to invest $90 million to create an Advanced Research Projects Agency for Education (ARPA-ED). ARPA-ED will fund projects performed by industry, universities, or other innovative organizations, selected based on their potential to create a dramatic breakthrough in learning and teaching.
ARPA-ED is trying to catalyze development of:
* Digital tutors as effective as personal tutors.
* Courses that improve the more students use them.
* Educational software as compelling as the best videogame.
The intuition here is really interesting -- building technologies for education that scale. Our ed system is based on a 150-year-old chalk-and-talk delivery system. One teacher, ~20 students, one lecture at a time, interspersed with homework, projects, and some small group discussion. I'm stylizing here, but you know I'm not too far off.
The major bottleneck in this system is effective teachers. Roughly speaking, the number of students getting a good classroom education is equal to the number of good teachers times twenty. Given the tremendous difficulty of recruiting, training, and retaining teachers, this is a serious constraint.
Therefore, I am a huge fan of the idea of deploying better education via scalable technology. But I don't think we've seen this done right yet. Some also-rans:
- i-tunes U and similar platforms strike me as a partial first step -- maybe a good replacement for lectures. Suppose I'm a middling public speaker with reasonably good subject knowledge in an area. Why should I lecture when my students can hear from a top-of-the field virtuoso? But education is a lot more than content delivery. itunes can't give you feedback, answer questions, or hold office hours.
- In the long run, private online universities may be able step up to provide scalable education. But so far I've been pretty unimpressed. For instance, University of Phoenix seems to be running a pump-and-dump model based on government subsidies through student loans. (Maybe I'm out of line on this claim, but that's my impression.)
Wednesday, March 9, 2011
Three cheers for crowd source/ open source
Google is offering $10k in prizes for visualizations of the U.S. Federal budget.
R has overtaken Matlab and SAS in popularity
HP is now including a Linux-based OS with every PC it ships.
R has overtaken Matlab and SAS in popularity
HP is now including a Linux-based OS with every PC it ships.
Information visualization and the Battle of the Atlantic
WWII was arguably the first war fought through information as much as weaponry. One of Neal Stephenson's characters in Cryptonomicon has a great monologue on this point. He claims that Nazi Germany typifies the values of Ares (you know, the Greek god of war), and the U.S./U.K. typify the values of Athena. In this telling, WWII Germany had an advantage in guns and regimentation, but the proto-hacker cryptographers of Bletchley Park, etc. ran rings around them with information. I recommend the monologue, but not the whole book.
This comes out in Churchill's narrative. Exhibit A is a set of FlowingData-esque maps of merchant ships sunk by U-boats throughout the war.
A little background: in the middle part of the war (once France had been defeated, but before Russia and the U.S. had entered) the "Battle of the Atlantic" was probably the single most important "front" in the war. As long as England was connected to her colonies by convoys of merchant ships, she could continue to fight. If bombing and U-boat action could constrict this flow of trade sufficiently, the little island would have no chance.
Exhibit A: (scanned on the cheap with my pocket digital camera)

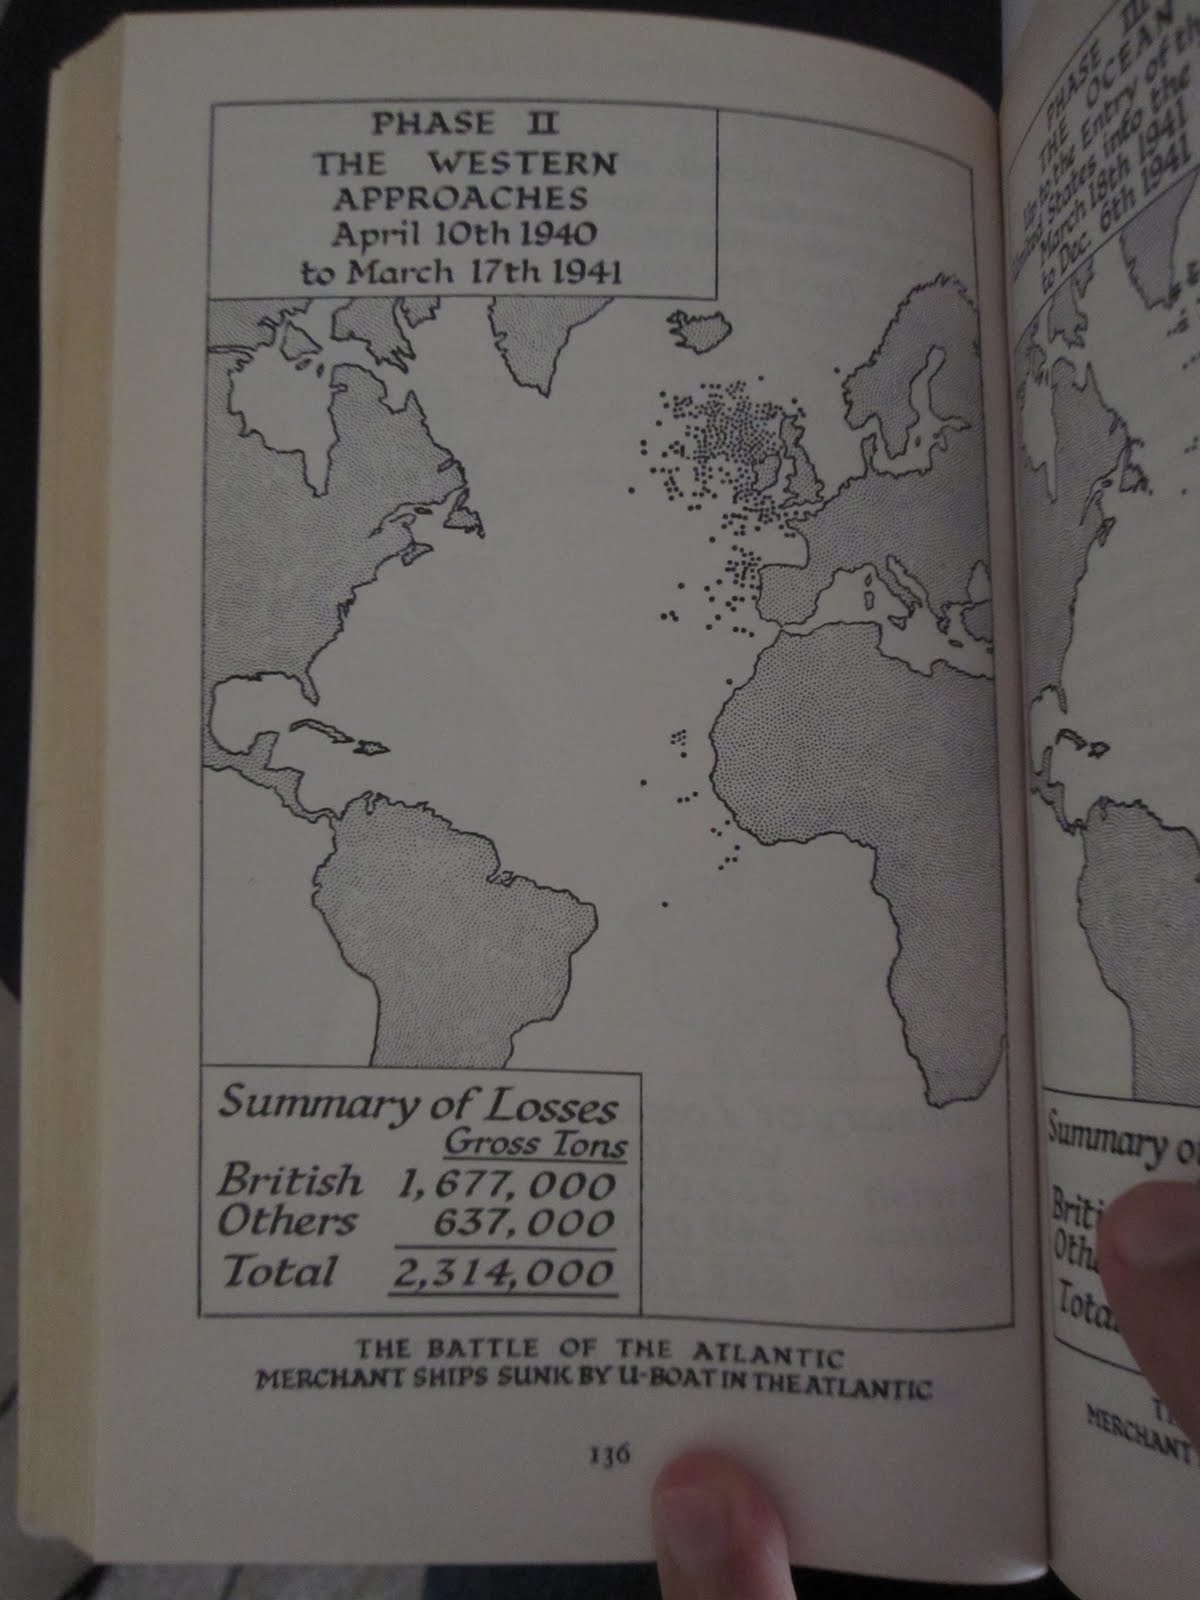

Charts like these make it clear that Churchill was interacting on wartime data on a day-to-day basis, and that that flow of information was crucial to war effort. Churchill likes to attribute success to the bulldog-like grit and willpower of the British people, but it's clear from his narrative that the flow of information was at least as important. In war, grit doesn't matter much without gunpowder.
In addition to maps, Churchill gives statistics and monthly trends for various gains and losses in shipping. They remind me of post-game trend plots in Starcraft II. The general tension between military and economy is the same. They also remind me of the dashboards that are all the rage in business process management these days. 50 years ago, you had to be a superpower at war to devote these kinds of resources to information gathering. Now, any reasonable-sized business has them. Heck, even this blog is hooked up to sitemeter. Map of the world, populated with little dots? Check.
Tuesday, March 8, 2011
AI for rock, paper, scissors
A really simple and clever demonstration of another place AI is surprisingly good at beating people: a rock-paper-scissors game on NYTimes. Don't laugh. The computer analyzes your past play and looks for weaknesses to exploit. I played it 100 times and lost 23 to 35, with 42 ties. (I said don't laugh!)
Nifty application. Nice design. The "see what the computer is thinking" is a great way of explaining how the AI works. Much better than saying it's a 4th-order Markov process with backing off.
The small print on the side of the screen is revealing (emphasis mine):
PS. I ran the numbers. The odds of me doing so poorly against the computer in an even game (one third wins, one third losses, one third ties) are about one in 60, a p value of 0.015. Not impossible, but extremely unlikely. So the smart money is on the computer.
Nifty application. Nice design. The "see what the computer is thinking" is a great way of explaining how the AI works. Much better than saying it's a 4th-order Markov process with backing off.
The small print on the side of the screen is revealing (emphasis mine):
Note: A truly random game of rock-paper-scissors would result in a statistical tie with each player winning, tying and losing one-third of the time. However, people are not truly random and thus can be studied and analyzed. While this computer won't win all rounds, over time it can exploit a person's tendencies and patterns to gain an advantage over its opponent.This is nice evidence that people are surprisingly bad at being unpredictable.
PS. I ran the numbers. The odds of me doing so poorly against the computer in an even game (one third wins, one third losses, one third ties) are about one in 60, a p value of 0.015. Not impossible, but extremely unlikely. So the smart money is on the computer.
Monday, February 28, 2011
What examples for successful prediction do we have in social science?
A question that's been bugging me: as social scientists, what can we predict reasonably well?
Following Kuhn's definition for a scientific paradigm, I'm focusing on:
1) social phenomena
2) that we can predict with enough accuracy to be useful
3) using technical skills that require special training.
I've found surprisingly few examples that satisfy all of these criteria. Only three, in fact.
What areas *should* we be able to predict? We have all kinds of new tools as social scientists. It seems like we should be ready to tackle some new challenges.
Following Kuhn's definition for a scientific paradigm, I'm focusing on:
1) social phenomena
2) that we can predict with enough accuracy to be useful
3) using technical skills that require special training.
I've found surprisingly few examples that satisfy all of these criteria. Only three, in fact.
- Aptitude testing
Prediction: How well will a person perform in school, a given job, the Army, etc.?
Technical skill: Psychometrics - Microeconomics
Prediction: What effect will various market interventions have on the price, quantity supplied, etc. for a specific good?
Technical skill: Producer, consumer, and game theory - Election polling
Prediction: Who will win in a given election?
Technical skills: Survey design, sampling theory
What areas *should* we be able to predict? We have all kinds of new tools as social scientists. It seems like we should be ready to tackle some new challenges.
Saturday, February 26, 2011
How to do research that has an impact, and still survive
Fascinating talk by Richard Hamming, of hamming code fame: You and Your Research. It's a very long and detailed discussion of how to build a scientific career in a way that will maximize the long-term impact of your work.
And here's an interesting counterpoint from the other end of a scientific career: how to survive grad school. Some Modest Advice for Graduate Students.
And here's an interesting counterpoint from the other end of a scientific career: how to survive grad school. Some Modest Advice for Graduate Students.
Monday, February 21, 2011
Glenn Beck conspiracy generator
A Glenn Beck conspiracy generator.
How does this thing work? I'm guessing mturk or some mailing list. The phrases don't seem quite formulaic enough for Markov generation or automated madlibs.
How does this thing work? I'm guessing mturk or some mailing list. The phrases don't seem quite formulaic enough for Markov generation or automated madlibs.
Saturday, February 19, 2011
Best. Weather. Forecast. Ever.
Weatherspark uses the same data as everyone else, but they make it so much more usable. Gorgeous interactive maps, trends, and predictions.
Tuesday, February 15, 2011
Link mishmash
Here's some of what I've been reading/watching online lately.
1. From TED, on babies and how they "take statistics" to learn language. Super cute.
This is for roommates deciding how much the big room with the extra window is worth. Based on this analysis, which uses surveys and hedonic regression to put numbers on preferences. (PS - "Hedonic Regression" would be a fantastic name for a nerd band.)
3. Two articles on credentialism in academia: from businessinsider, via Mike Bommarito; and from Steven Hsu, at Andrew Gelman's blog.
Interesting points made here. Has the value of formal, certified education increased or decreased? What about the quality of education? I've grown increasingly pessimistic about this topic of late.
4. And last, but not least a caption contest at wondermark (I love this web comic). Here's the pic. Submissions wanted.

1. From TED, on babies and how they "take statistics" to learn language. Super cute.
- Comprehension question: at what age did you stop being able to understand Mandarin?
- Presentation question: why does using FMRI/MEG/etc. increase one's credibility as a scientist? Several minutes of this 10-minute clip talk about brain activity and MEG output. But none of the important findings here are based on that data -- only speculation.
This is for roommates deciding how much the big room with the extra window is worth. Based on this analysis, which uses surveys and hedonic regression to put numbers on preferences. (PS - "Hedonic Regression" would be a fantastic name for a nerd band.)
3. Two articles on credentialism in academia: from businessinsider, via Mike Bommarito; and from Steven Hsu, at Andrew Gelman's blog.
Interesting points made here. Has the value of formal, certified education increased or decreased? What about the quality of education? I've grown increasingly pessimistic about this topic of late.
4. And last, but not least a caption contest at wondermark (I love this web comic). Here's the pic. Submissions wanted.
How to win the final wager in Jeopardy
Here's a fun sideline to the human-vs-AI Jeopardy showdown: optimal wagering strategies for final Jeopardy. The challenge: given what you know about yourself, your opponents, their bankrolls, and the question, choose the betting strategy most likely to secure a win or at least a tie. What do you do?
As it happens, some smart game theorists have already worked on this problem. Work in the 1990's shows that against your average human, it's not too complicated.
Against a human (or computer) who knows some game theory, the ideal strategy is complicated, because your strategizing will prompt strategizing by your opponents, and vice versa, ad infinitum. The Gilbert and Hatcher paper gives a solution for the two-player scenario. This situation happens when one contestant has no money to wager in the final round -- it's actually not all that unusual.
The three-player scenario is unsolved, but it's almost certainly a mixed strategy. Sounds like a good problem for a different kind of AI: computational game theory. Given that simple versions of poker have been completely solved, a mixed strategy over wagers should be child's play.
With all that as background, here's IBM's page on how Watson wagers. They cite the ridiculously detailed Jeopardy folklore of betting strategies --- the entries for "two-thirds" and "Shore's conjecture" are particularly on point --- but evidently, they haven't worked through the game theory. Knowing this, Ken and Brad should be able to outflank Watson in the final round, giving them slightly better odds at cinching a win.
Punchline: in the world of AI, Watson is a verbal genius in need of some remedial math.
As it happens, some smart game theorists have already worked on this problem. Work in the 1990's shows that against your average human, it's not too complicated.
- If you're winning, assume your opponents will bet everything, and react accordingly by betting enough to double the number two player's score, plus one dollar.
- If you're in the middle it can be tricky, but a good bet is to triple your score and subtract double the first player's score.
- If you're losing by a lot, bet everything.
Against a human (or computer) who knows some game theory, the ideal strategy is complicated, because your strategizing will prompt strategizing by your opponents, and vice versa, ad infinitum. The Gilbert and Hatcher paper gives a solution for the two-player scenario. This situation happens when one contestant has no money to wager in the final round -- it's actually not all that unusual.
The three-player scenario is unsolved, but it's almost certainly a mixed strategy. Sounds like a good problem for a different kind of AI: computational game theory. Given that simple versions of poker have been completely solved, a mixed strategy over wagers should be child's play.
With all that as background, here's IBM's page on how Watson wagers. They cite the ridiculously detailed Jeopardy folklore of betting strategies --- the entries for "two-thirds" and "Shore's conjecture" are particularly on point --- but evidently, they haven't worked through the game theory. Knowing this, Ken and Brad should be able to outflank Watson in the final round, giving them slightly better odds at cinching a win.
Punchline: in the world of AI, Watson is a verbal genius in need of some remedial math.
Wednesday, February 9, 2011
Realtime Congress API
Just ran across this new API, for Congress, in real time. Put out by the Sunlight Foundation, an organization using "cutting-edge technology and ideas to make government transparent and accountable," the API allows you to track, floor actions, video, committee hearings, bills, amendments, votes, and other documents in real time.
Really looking forward to playing with this.
Really looking forward to playing with this.
Tuesday, February 8, 2011
Hard problems in social science
A Harvard conference on "Hard problems in social science" just wrapped up, with voting on the most important and most difficult problems. The ran the poll on facebook with 10,000 people weighing in.
Frontrunners include:
Frontrunners include:
- World peace
- Sustainable population growth
- Collective decision making
- Stable institutions
Saturday, February 5, 2011
Cracking the Ontario lottery - via Wired
A great story on the statistician who cracked the Ontario lottery -- how he cracked it, why the lottery didn't believe him, how other lotteries are probably breakable as well, and why the mob likes it that way. A great read, all the way through.
Model Makers' Hippocratic Oath
Model Makers' Hippocratic Oath:
- I will remember that I didn't make the world and that it doesn't satisfy my equations.
- Though I will use models boldly to estimate value, I will not be overly impressed by mathematics.
- I will never sacrifice reality for elegance without explaining why I have done so. Nor will I give the people who use my model false comfort about its accuracy. Instead, I will make explicit its assumptions and oversights.
- I understand that my work may have enormous effects on society and the economy, many of them beyond my comprehension.
Monday, January 31, 2011
QMD - A framework for prioritizing research ideas
This from a recent exchange with a research assistant. He's trying to decide what to do for his undergraduate honors thesis, and I was trying to give him some sage advice. Here's the practical framework I use when deciding what research ideas to pursue:
Every research paper is a combination of three main parts: 1) a question, 2) a methodology, and 3) data. For instance, the Druckman paper [from this week's reading] asks 1) when elite framing can influence opinion using 2) an experiment where 3) college students read and discuss news articles. ...
(By the way, "data" includes any kinds of facts you'd use to build your argument, not just numbers. Surveys, content analysis, government statistics, experimental results, interviews, historical case studies, etc. are all data -- they're just analyzed differently.)
The combination of QMD that you choose largely determines how hard it will be to carry out the project, the kinds of conclusions you will be able to draw, and the threats to validity that critics can use against you. Choosing the QMD for a research project is like choosing a major in college -- in a lot of ways, all the later decisions are just details.
When you choose which Q, M, and D to use, you can either come up with something completely new, or borrow ideas from past studies. It is much, much harder to come up with new questions, methods and data than it is to borrow from past research. As a strong rule of thumb, you only want one of your three parts to be new. So if you're asking a new question, use familiar methods and easy-to-find data. (This isn't plagiarism because you're completely up front about the idea that you're building on previous work.)
Probably the easiest kind of study to pull off is a replication study, using new data with old methods and questions. For example, to deal with one of the threats to validity in Druckman et. al's study, you might do the same experiment with a representative sample of people, instead of just college students. Same question, same method, different data. This would still take work, but there aren't a lot of unknowns in the process, and anyone who believes Druckman and Nelson will probably believe your results as well. Replication studies are good for boosting ("Not only are Druckman and Nelson right about framing effects for college students -- they're right about all American adults as well!") or cutting back ("Druckman and Nelson's findings only apply to people under 30. Everyone else is much less susceptible to elite framing.") the scope of previous findings.
The next hardest is applying a new method to an old question. For example, you might ask when elite framing influences public opinion using a series of carefully timed surveys asking the same questions that Druckman et al used. Similar question, different method, similar data. This is a little harder, because you'd have to use different skills, build a new kind of argument, and deal with new threats to validity. On the plus side, different methods have different threats to validity, so if you use a new method, you can probably address some of the threats to validity that previous studies couldn't. For example, timed surveys could deal with the "recency effects" that Druckman can't do much about.
Introducing new questions is the hardest of all, for at least three reasons. First, you have to convince people that your question is worth asking. This is harder than it sounds. In my experience, people like to think they already understand the world pretty well, so they will resist the notion that you've found a blind spot in their worldview. Second, you have to be able to convince people that you're the first one to ask the question. Third, you have to build an entirely new line of evidence to defend your reasoning. With a one-semester deadline, I'd advise against trying to introduce a new question, just because it's so hard to do.
Anyway, that might be more than you want to know, but it's the way I decide what research projects to take on. QMD is my framework for figuring out what topics are in the overlap of "interesting" and "doable."
Thoughts?
Thursday, January 27, 2011
Inspiring, hopeful, education, and salmon -- Not in that order
This is everywhere already, so why not put it up here too? NPR asked people what they heard in the state of the union, then put the 4,000+ responses into a word cloud. Here it is.
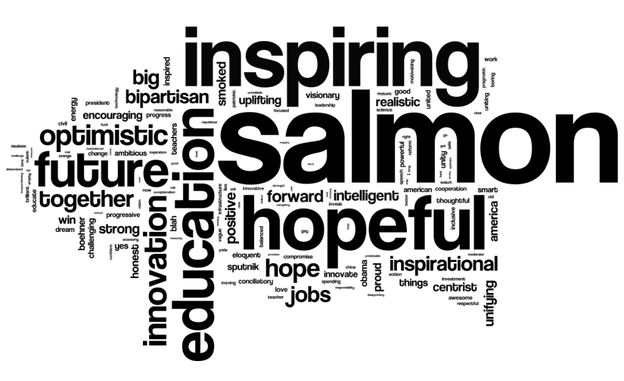 Remind me to include a couple of jokes next time I give a talk.
Remind me to include a couple of jokes next time I give a talk.
Pennsylvania Policy Database Project
I just ran across this project, with some interesting data sets on policy making in Pennsylvania. I'll come back later to investigate in more detail.
Wednesday, January 26, 2011
bubbl.us: A great little tool for flowcharts
As I've gotten serious about this whole dissertation thing, I've realized that the process can get pretty complicated. "Before I can launch the survey, I need to draw the sample and write the questionnaire. But before I can write the questionnaire, I have to read the three papers that talk about measuring ideology, and ..." To cope, I've found myself drawing a lot of flowcharts to map dependencies.
Two days ago, I found this great little tool for flowcharts: bubbl.us. It's free, unless you want the premium license, and it has a really nice interface. Once you learn how to tab and shift-click and everything, you can sketch out complicated charts very quickly. If you allow it some room on your hard drive, you can even save maps between sessions. As I said, I'm using it primarily for mapping workflow, but I could see it being useful for brainstorming, simple org charts, or flow diagrams too.
And with that said, here's the map through the dissertation quagmire to the end of the semester.

Thursday, January 13, 2011
An Interview with Ronald Coase
A fascinating snippet of an interview with the famous Ronald Coase:
Snipped here (Knowledge Problem just made my blogroll), with a hat tip to marginal revolution
RC: Nothing guarantees success. Given human fallibility, we are bound to make mistakes all the time.
WN: So the question is how we can learn from experiments at minimal cost. Or, how could we structure our economy and society in such a way that collective learning can be facilitated at a bearable price?
RC: That’s right. Hayek made a good point that knowledge was diffused in society and that made central planning impossible.
WN: The diffusion of knowledge creates another social problem: conflict between competing ideas. To my knowledge, only people fight for ideas (religious or ideological), only people are willing to die for their ideas. The animal world might be bloody and uncivilized. But animals, as far as we know, do not fight over ideas.
RC: That’s probably right. That’s why we need a market for ideas. Ideas can compete; people with different ideas do not need to slaughter each other.
Really interesting tension. I'm still working through what to make of it. Collectively, we're smarter because we disagree? And vice versa?Snipped here (Knowledge Problem just made my blogroll), with a hat tip to marginal revolution
Saturday, January 1, 2011
Optimal Poker AI -- I told you so!
A couple years ago, I had a long debate about Texas Hold'em with my brother, a long-time aficionado of the game. He's quite good and he's roomed with friends who actually payed the bills playing online poker. So you can see why he'd get defensive when I claimed that there is an optimal strategy for heads-up Texas Hold'em.
I've thought back to that conversation several times, mainly because it was really frustrating for both of us. I had a proof backing me up -- Von Neuman's 80-year-old minimax theorem* -- an absolutely airtight mathematical proof, but I still couldn't convince him. The problem is that it's an existence proof, so it demonstrates that the strategy must exist, but doesn't tell you what the strategy is. And of course, arguing that "my math says there's an optimal strategy" rings pretty hollow when you can't answer the question, "so what's the strategy?"
So I was very happy to run across this paper and demo presenting the optimal strategy for Rhode Island Hold'em. Rhode Island poker is a stripped down version of Texas Hold'em (get it?). You play with a smaller deck, only one hole card, a one-card flop, and a one-card turn, but no river. There are a few limits on betting, but the game is essentially the same. According the abstract, "Some features of the [optimal strategy] include poker techniques such as bluffing, slow-playing, check-raising, and semi-bluffing."
Very nifty proof of concept.
* A little bit more on the math. The minmax theorem states that every one-on-one winner-take-all game has an optimal strategy profile. A quick FAQ on what it means to be an optimal strategy.
So what does it mean that the strategy is optimal?
The technical definition is that it's an equilibrium strategy. If both players are playing the optimal strategy, neither has an incentive to deviate and play anything else. As one of my profs would say, it's prediction proof. Even if we both know each others' strategies, neither of us has an incentive to deviate.
So this strategy always wins?
No. There is some luck in the game. But if you played it repeatedly, there's no way you would win more than half the time. Almost any non-optimal strategy you'd play, the computer would beat you more than half the time.
Wouldn't an "optimal strategy" be really predictable?
No. In poker, it's often useful to bluff and keep your opponent guessing, so the optimal strategy is partly random. That means that when facing a given situation (e.g. After the flop, I have X cards, I did Y pre-flop, and my opponent did Z) the computer will flip a weighted coin to make its decision (e.g. 3/4 of the time I fold, 1/8 of the time I raise, and 1/8 of the time I check.) So the strategy is perfectly well-defined, but still unpredictable at times.
Does it know how to play short-stack and long-stack poker?
I don't think so. As far as I can tell, Rhode Island poker is played one hand at a time, with limits on betting. So the optimal strategy doesn't need to know anything about stack length, escalating blinds, going all in, etc.
If you introduced those elements, you'd be playing a different game. According to the min-max theorem, there would still be an optimal strategy, but it would probably be at least a little different.
Subscribe to:
Comments (Atom)